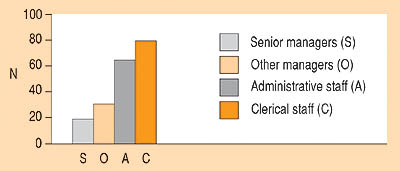
This vertical bar chart shows the number of staff in each of four categories.
The vertical scale is labelled N and runs from 0 to 100, it is marked at intervals of 20.
Reading from the key shown, the bars from left to right are labelled Senior managers (S), Other managers (M), Adminstrative staff (S) and Clerical staff (C).
The chart shows clearly that the numbers of staff increase in the order shown, from Senior managers to Clerical staff and that the biggest difference is between Other managers and Clerical staff.
The values are given in Table 6.6 in the text and are:
Senior managers = 20
Other managers = 30
Adminstrative staff = 70
Clerical staff = 80
Использованные ресурсы:
http://kn.open.ac.uk/public/index.cfm?wpid=3026
далее: Описание "Bar chart" (пример 2)