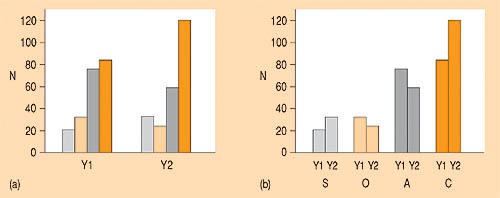
These two vertical bar charts shows the number of staff in each of four categories in Year 1 and Year 2.
The vertical scale is the same for both, it is labelled N and runs from 0 to 120, it is marked at intervals of 20.
There is no key shown, the bars are identified from previous graphs in the series as Senior managers (S), Other managers (M), Adminstrative staff (S) and Clerical staff (C).
The charts both show the same data but with the bars grouped differently.
In (a) from left to right they show the figures for Year 1 for Senior managers, Other managers, Adminstrative staff and Clerical staff, followed by the figures for Year 2.
In (b) from left to right they show the figures for Year 1 and Year 2 for Senior managers, followed by the figures for Year 1 and Year 2 for Other managers, followed by the figures for Year 1 and Year 2 for Adminstrative staff and lastly by the figures for Clerical staff for Year 1 and Year 2.
As explained in the text, version (b) of the figure emphasises the large differences between the numbers of staff in each category, rather than the smaller differences between years.
The values are given in Table 6.7 in the text and are:
Senior managers, Year 1 = 20, Year 2= 35
Other managers, Year 1 = 30, Year 2 = 25
Adminstrative staff, Year 1 = 70, Year 2 = 60
Clerical staff, Year 1 = 80, Year 2 = 130
Использованные ресурсы:
http://kn.open.ac.uk/public/index.cfm?wpid=3026
далее: Практическое задание 5 - Описание "Pie chart"