From an Open University book, Ocean Basins: their structure and evolution, figure 6.9, page 135.
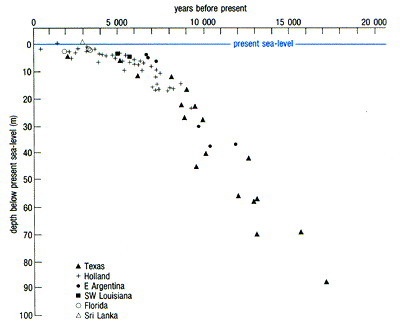
Figure 6.9 The chronology of the sea-level over the past 18,000 years deduced from 14C dating of peat and the shells of shallow-water marine organisms. All locations are in shallow areas of the Earth's crust, where major earth movements have been negligible. Although there is a wide scatter in the data, the points define a trend for global sea-level change.
This scatter graph plots sea-level depth over time using data from 6 regions.
The horizontal axis is at the top and is labelled "years before present". It is marked in years from 0 to 20,000 at intervals of 1000 years.
The vertical axis is labelled "depth below present sea-level (m)" and is marked in metres from 0 to 100, at intervals of 10 meters.
The 6 locations are represented by different small symbols given in a key.
solid triangle = Texas
cross = Holland
solid dot = East Argentina
square = South-west Louisiana
open dot = Florida
open triangle= Sri Lanka
The general trend is an increase in depth as the past time increases. The increase is small in the recent past, up to 7,000 years ago at a depth of just over 10 metres then it increases more sharply to the lowest point marked at just under 18,000 years and 90 metres.The earliest data, from about 12,000 years and earlier is from Texas.
The trend is quite clear, although the band is wide, there are no data points in other areas of the graph.
An example of the wide scatter is shown in the Texas data, there are three points at about 45 metres over a spread of about 3,500 years. There are also three points at 13,000 years, two are at 60 metres, the other is at 70 metres.

Использованные ресурсы:
http://kn.open.ac.uk/public/index.cfm?wpid=3026
далее: Описание "Bar chart" (пример 1)